

Skip to content

Find your way around

3 min read

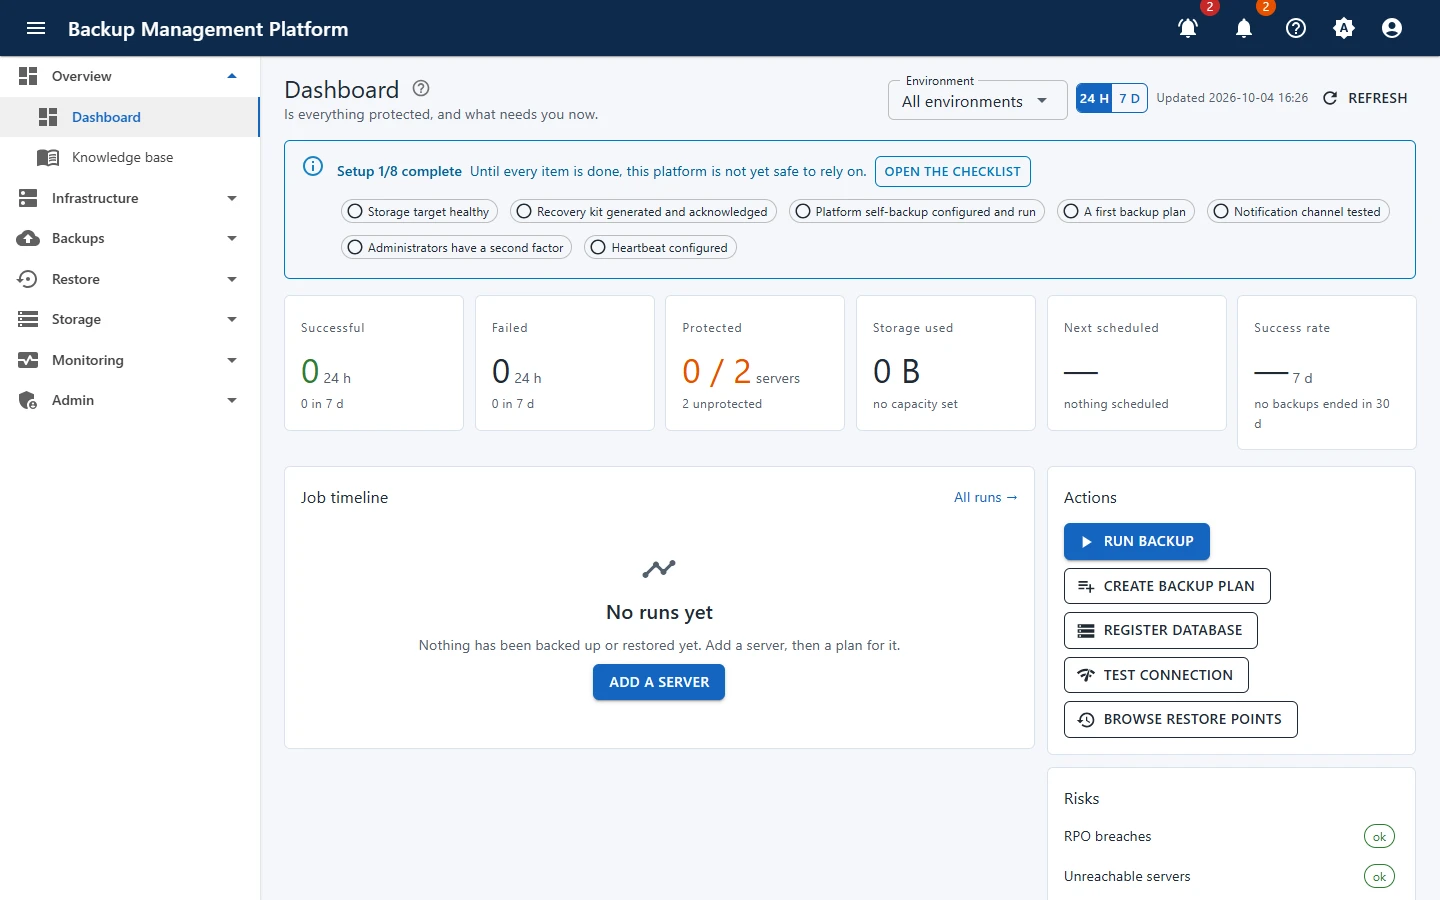
The dashboard, with the parts of the screen you use every day

On this screen:

  • Show or hide the menu
  • Menu areas - open one to see its screens
  • Open alerts in your scope
  • Notification centre - recent events
  • Knowledge base - this manual
  • Theme - system, light or dark
  • Account - preferences, security, sign out
  • Setup checklist (administrators)
  • Filter by environment and period
  • Key figures for the period
  • Job timeline - recent runs
  • Actions - common jobs in one click
  • Risks that need attention

Page header

Title, what the page is for, and its main buttons on the right. The ? beside a title opens its help article.
Lists

Filter, sort and page through rows; click a row to open it. Large lists load one page at a time.

Wizards

Long tasks are split into numbered steps. Back and Next keep what you typed; nothing is saved until the last step.

Confirmations

Anything destructive asks first; the riskiest ask you to type the item’s name and give a reason for the audit log.

Green

Succeeded, healthy, online, verified.

Blue

Running, stored, approved - in progress or fine.

Amber

Warnings, interrupted, pending approval, degraded.

Red

Failed, unreachable, host key mismatch, corrupt or missing.

Grey

Queued, cancelled, skipped, disabled or unknown.
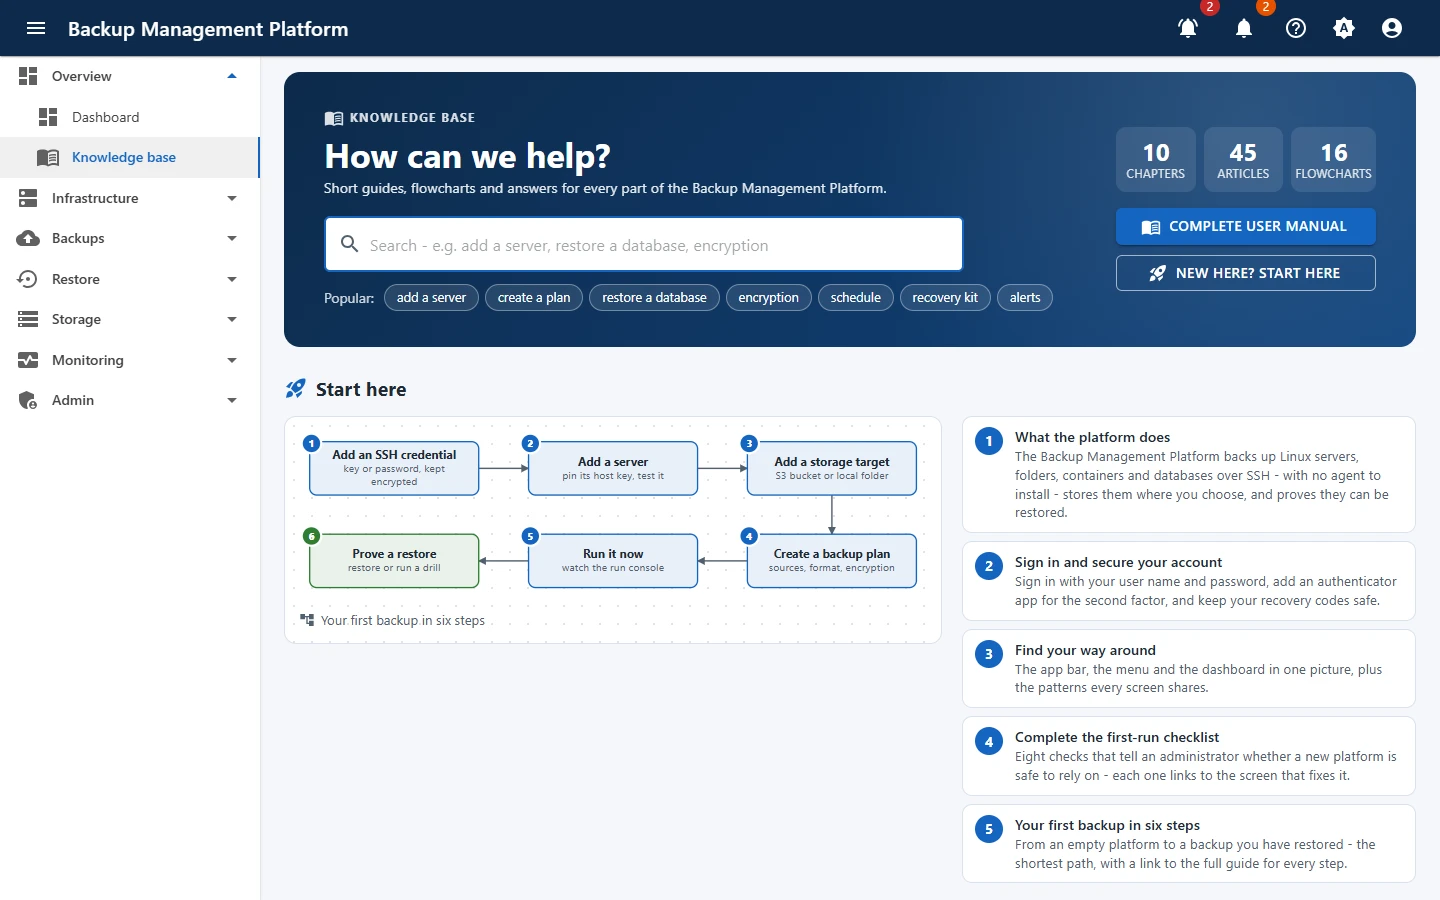
The knowledge base - search, chapters, the quick start and the complete manual
  • Click ? in the app bar, or Overview › Knowledge base in the menu.
  • Type in the search box - results appear as you type, including single answers from the FAQ.
  • The ? beside a page title opens the article about that page.
  • Complete user manual shows everything on one page, with Print and Download PDF.